Gel-based oligonucleotide microarray approach to analyze ligand- and protein-DNA binding specificity

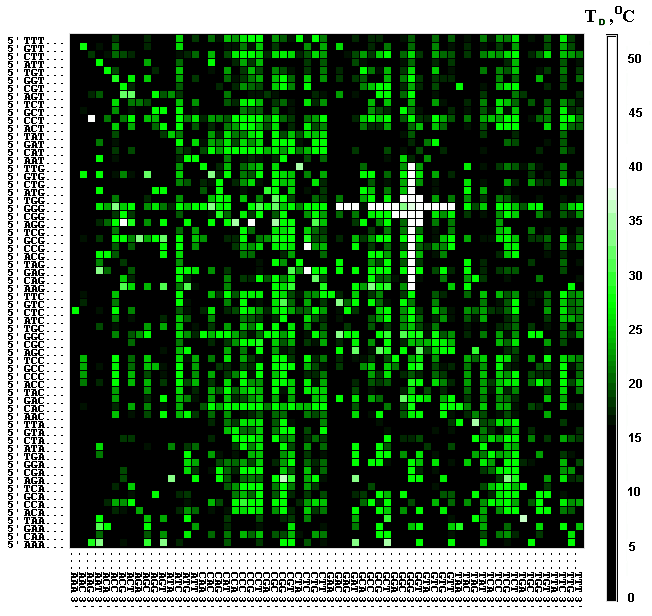
Figure 1. Computer representation of the data set for dissociation temperatures, TD, of the complexes between fluorescently labeled p50 protein (Y-box binding transcriptional factor) and octadeoxyribonucleotides immobilized on the generic microchip. Inner 6-mers of oligonucleotide 8-mers in this computer representation are arranged as two-dimensional matrix according to their 5'-halves in the rows and 3'-halves in the columns (Drobyshev et al., NAR, 1999). Color intensity of each small square reflects the TD value of the corresponding p50 - ss 8-mer complex. Color scale of the temperatures is shown on the right. P50 showed the highest sequence-specificity of binding to motifs 5'-NNGGGG-3', 5'-GGGGNN-3', 5'-NGGGGN-3', which are found in white cross on the matrice. (Zasedateleva et al., JMB, 2002).
|

